A CRM pipeline that just tracks where deals are is a reporting tool. A CRM pipeline that tells you what to do next — which deals need attention today, which are likely to close this month, which have been stalled too long at their current stage — is a management tool. The difference between the two is not the software. It is the design decisions made before any deal was created. This guide covers the design and management of a Zoho CRM sales pipeline that actually improves sales performance rather than just recording it. For the full sales system context, see the Revenue Engine Pro sales system. For the CRM strategy decisions that must precede pipeline design, see the CRM strategy guide.
Why Most CRM Pipelines Fail to Deliver Value
Three pipeline design problems appear in the majority of implementations ABR audits:
- Default stages that do not match the actual sales process. Zoho CRM’s out-of-the-box pipeline stages were inherited from Salesforce’s 1998 methodology and describe a generic enterprise B2B sale that few SMBs actually follow. A pipeline built on stages that do not reflect reality produces data that does not reflect reality.
- Stage names based on activities rather than client situations. “Proposal Sent” tells you what the rep did. “Client Reviewing Proposal” tells you where the deal actually is. The distinction matters when a rep sends a proposal and forgets to progress the deal — the activity stage shows progress that has not actually occurred.
- Probability weights set to software defaults. Default pipeline probability weights represent a generic business’s conversion rates in 1998. Your business has its own conversion rates at each stage. A forecast built on wrong probability weights is not a forecast — it is a fiction.
Pipeline Stage Design: The Principles
Every Stage Must Be Observable
An observable stage is one where you can verify a deal is genuinely there by looking at the record — not by asking the rep. “In Progress” is not observable. “Technical Demo Completed — Awaiting Evaluation Decision” is observable: you can look at the activity log and confirm the demo happened. If you cannot verify a stage assignment from the data, the stage is subjective and will be applied inconsistently across the team.
Every Stage Must Represent Real Commercial Progress
Moving from one stage to the next should mean something has changed in the client’s position — not just in the rep’s activity. “Proposal Sent” progresses when the rep sends an email. “Proposal Under Review” progresses when the client confirms receipt and is actively evaluating. The commercial situation has changed. Stages that advance based on rep actions rather than client responses produce pipelines where deal health cannot be assessed from the stage alone.
Every Stage Should Trigger Specific Next Actions
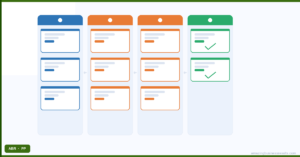
A deal that enters a stage should know what happens next. In Zoho CRM, Blueprint connects stage transitions to required actions and automated triggers. A deal entering “Proposal Under Review” triggers: an automated task for the rep to check in at day five, a notification to the manager for deals above a value threshold, and a calendar event for the expected decision date. The pipeline becomes actionable rather than just descriptive.
Setting Probability Weights from Your Own Data
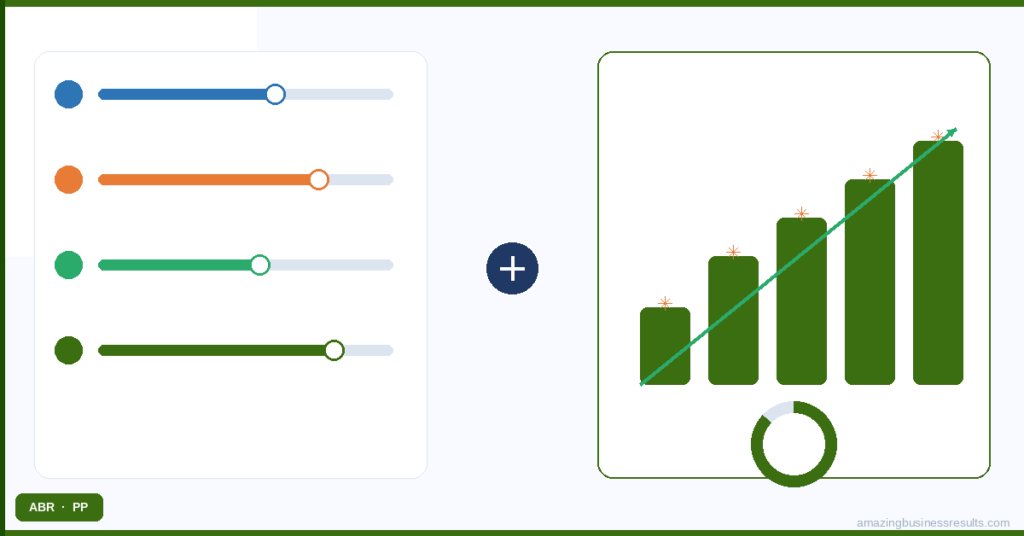
Probability weights in Zoho CRM’s forecast module determine how much of each deal’s value is counted in the pipeline forecast. A deal at a stage weighted 50% contributes half its value to the forecast. If your actual historical win rate for deals at that stage is 30%, a 50% weight overstates the forecast by 67%. If your actual win rate is 70%, a 50% weight understates it.
Calculate your actual stage-by-stage conversion rates from your historical deal data. Export all deals closed in the last twelve months. For each pipeline stage, calculate: how many deals that passed through this stage ultimately closed Won? That percentage is your probability weight. Update it quarterly as your sales performance evolves. A forecast built on your own historical data is a genuine planning input.
Deal Health Monitoring: Catching Stalled Deals Before They Die
The most common reason deals are lost without the sales team realising it: they go quiet. The client stops responding. The rep continues to log the deal as active because closing it feels like an admission of failure. The pipeline value stays high. The forecast stays optimistic. The actual close probability approaches zero while the CRM data suggests it is progressing normally.
Zoho CRM prevents this through time-in-stage monitoring. A workflow rule triggers when a deal has been in the same stage for longer than the typical progression time for that stage (calculated from historical data). The trigger creates a high-priority task for the rep and a notification to the manager. The deal gets attention before it dies quietly rather than after it has been lost for three weeks.
The daily “stale deal” view in the pipeline dashboard — deals with no logged activity in the past 14 days, sorted by value — is one of the most valuable management tools in a well-configured Zoho CRM. It surfaces the deals that need attention today without requiring any manual pipeline review.
Sales Forecasting in Zoho CRM
Zoho CRM’s forecast module takes your pipeline data — deal values, probability weights by stage and expected close dates — and projects expected revenue for the current and future periods. The output is only as reliable as the inputs: accurate deal values, realistic stage probability weights and close dates that are reviewed and updated regularly.
The forecast is most useful when it is reviewed by management weekly, not monthly. A weekly forecast review that identifies deals where close dates have slipped, where stage progression has stalled or where new high-value deals have entered the pipeline allows management to redirect sales resources in real time rather than after a quarter has closed.
Pipeline Articles on This Topic
Deals, Pipelines and Stages in Zoho CRM — the complete guide to setting up pipeline stages.
Zoho CRM Forecasting Tools: Predicting Your Sales — using Zoho CRM forecasting effectively.
Sales Pipeline Design Best Practices — advanced pipeline design principles.
Tracking Win Rates and Conversion in Zoho CRM — measuring and improving win rates.
Zoho CRM Activities: Managing Calls, Tasks and Events — activity management and logging.
Zoho CRM Sales Hub — every guide on leads, pipeline, comparisons and sales strategy.
Frequently Asked Questions
Where do I find win rate in Zoho CRM?
Zoho CRM does not have a pre-built win rate report, but it is straightforward to build: go to Reports → Deals → create a Summary Report grouped by Stage with Won/Lost outcome counts. Divide Won count by total closed (Won + Lost) to get win rate. Save as a dashboard component.
How often should I review win rate?
Monthly for trend analysis — win rate is a lagging indicator that needs a meaningful sample size. Weekly pipeline reviews should focus on pipeline health (stale deals, upcoming closes) rather than win rate, which changes slowly enough that weekly fluctuations are mostly noise.
What is a good win rate for a B2B sales team?
B2B win rates from qualified opportunities typically range 20–40% for most SMBs. The number matters less than the trend and the stage-by-stage breakdown. A 25% win rate with clear understanding of where losses occur is more actionable than a 35% rate with no visibility.
Can Zoho CRM show win rate trends over time?
Yes — create a Deals report filtered by Closing Date and grouped by month, comparing Won vs Lost counts. This gives a monthly win rate trend line showing whether performance is improving or declining over time.
Can ABR set up win rate reporting for our Zoho CRM?
Yes — win rate dashboards are part of every ABR Zoho CRM implementation. Book a free consultation →
{"@context":"https://schema.org","@type":"FAQPage","mainEntity":[{"@type":"Question","name":"Where do I find win rate in Zoho CRM?","acceptedAnswer":{"@type":"Answer","text":"Zoho CRM does not have a pre-built win rate report, but it is straightforward to build: go to Reports → Deals → create a Summary Report grouped by Stage with Won/Lost outcome counts. Divide Won count by total closed (Won + Lost) to get win rate. Save as a dashboard component."}},{"@type":"Question","name":"How often should I review win rate?","acceptedAnswer":{"@type":"Answer","text":"Monthly for trend analysis — win rate is a lagging indicator that needs a meaningful sample size. Weekly pipeline reviews should focus on pipeline health (stale deals, upcoming closes) rather than win rate, which changes slowly enough that weekly fluctuations are mostly noise."}},{"@type":"Question","name":"What is a good win rate for a B2B sales team?","acceptedAnswer":{"@type":"Answer","text":"B2B win rates from qualified opportunities typically range 20–40% for most SMBs. The number matters less than the trend and the stage-by-stage breakdown. A 25% win rate with clear understanding of where losses occur is more actionable than a 35% rate with no visibility."}},{"@type":"Question","name":"Can Zoho CRM show win rate trends over time?","acceptedAnswer":{"@type":"Answer","text":"Yes — create a Deals report filtered by Closing Date and grouped by month, comparing Won vs Lost counts. This gives a monthly win rate trend line showing whether performance is improving or declining over time."}},{"@type":"Question","name":"Can ABR set up win rate reporting for our Zoho CRM?","acceptedAnswer":{"@type":"Answer","text":"Yes — win rate dashboards are part of every ABR Zoho CRM implementation. Book a free consultation →"}}]}